Sonuç veta yorumları paylaşma
Answer:
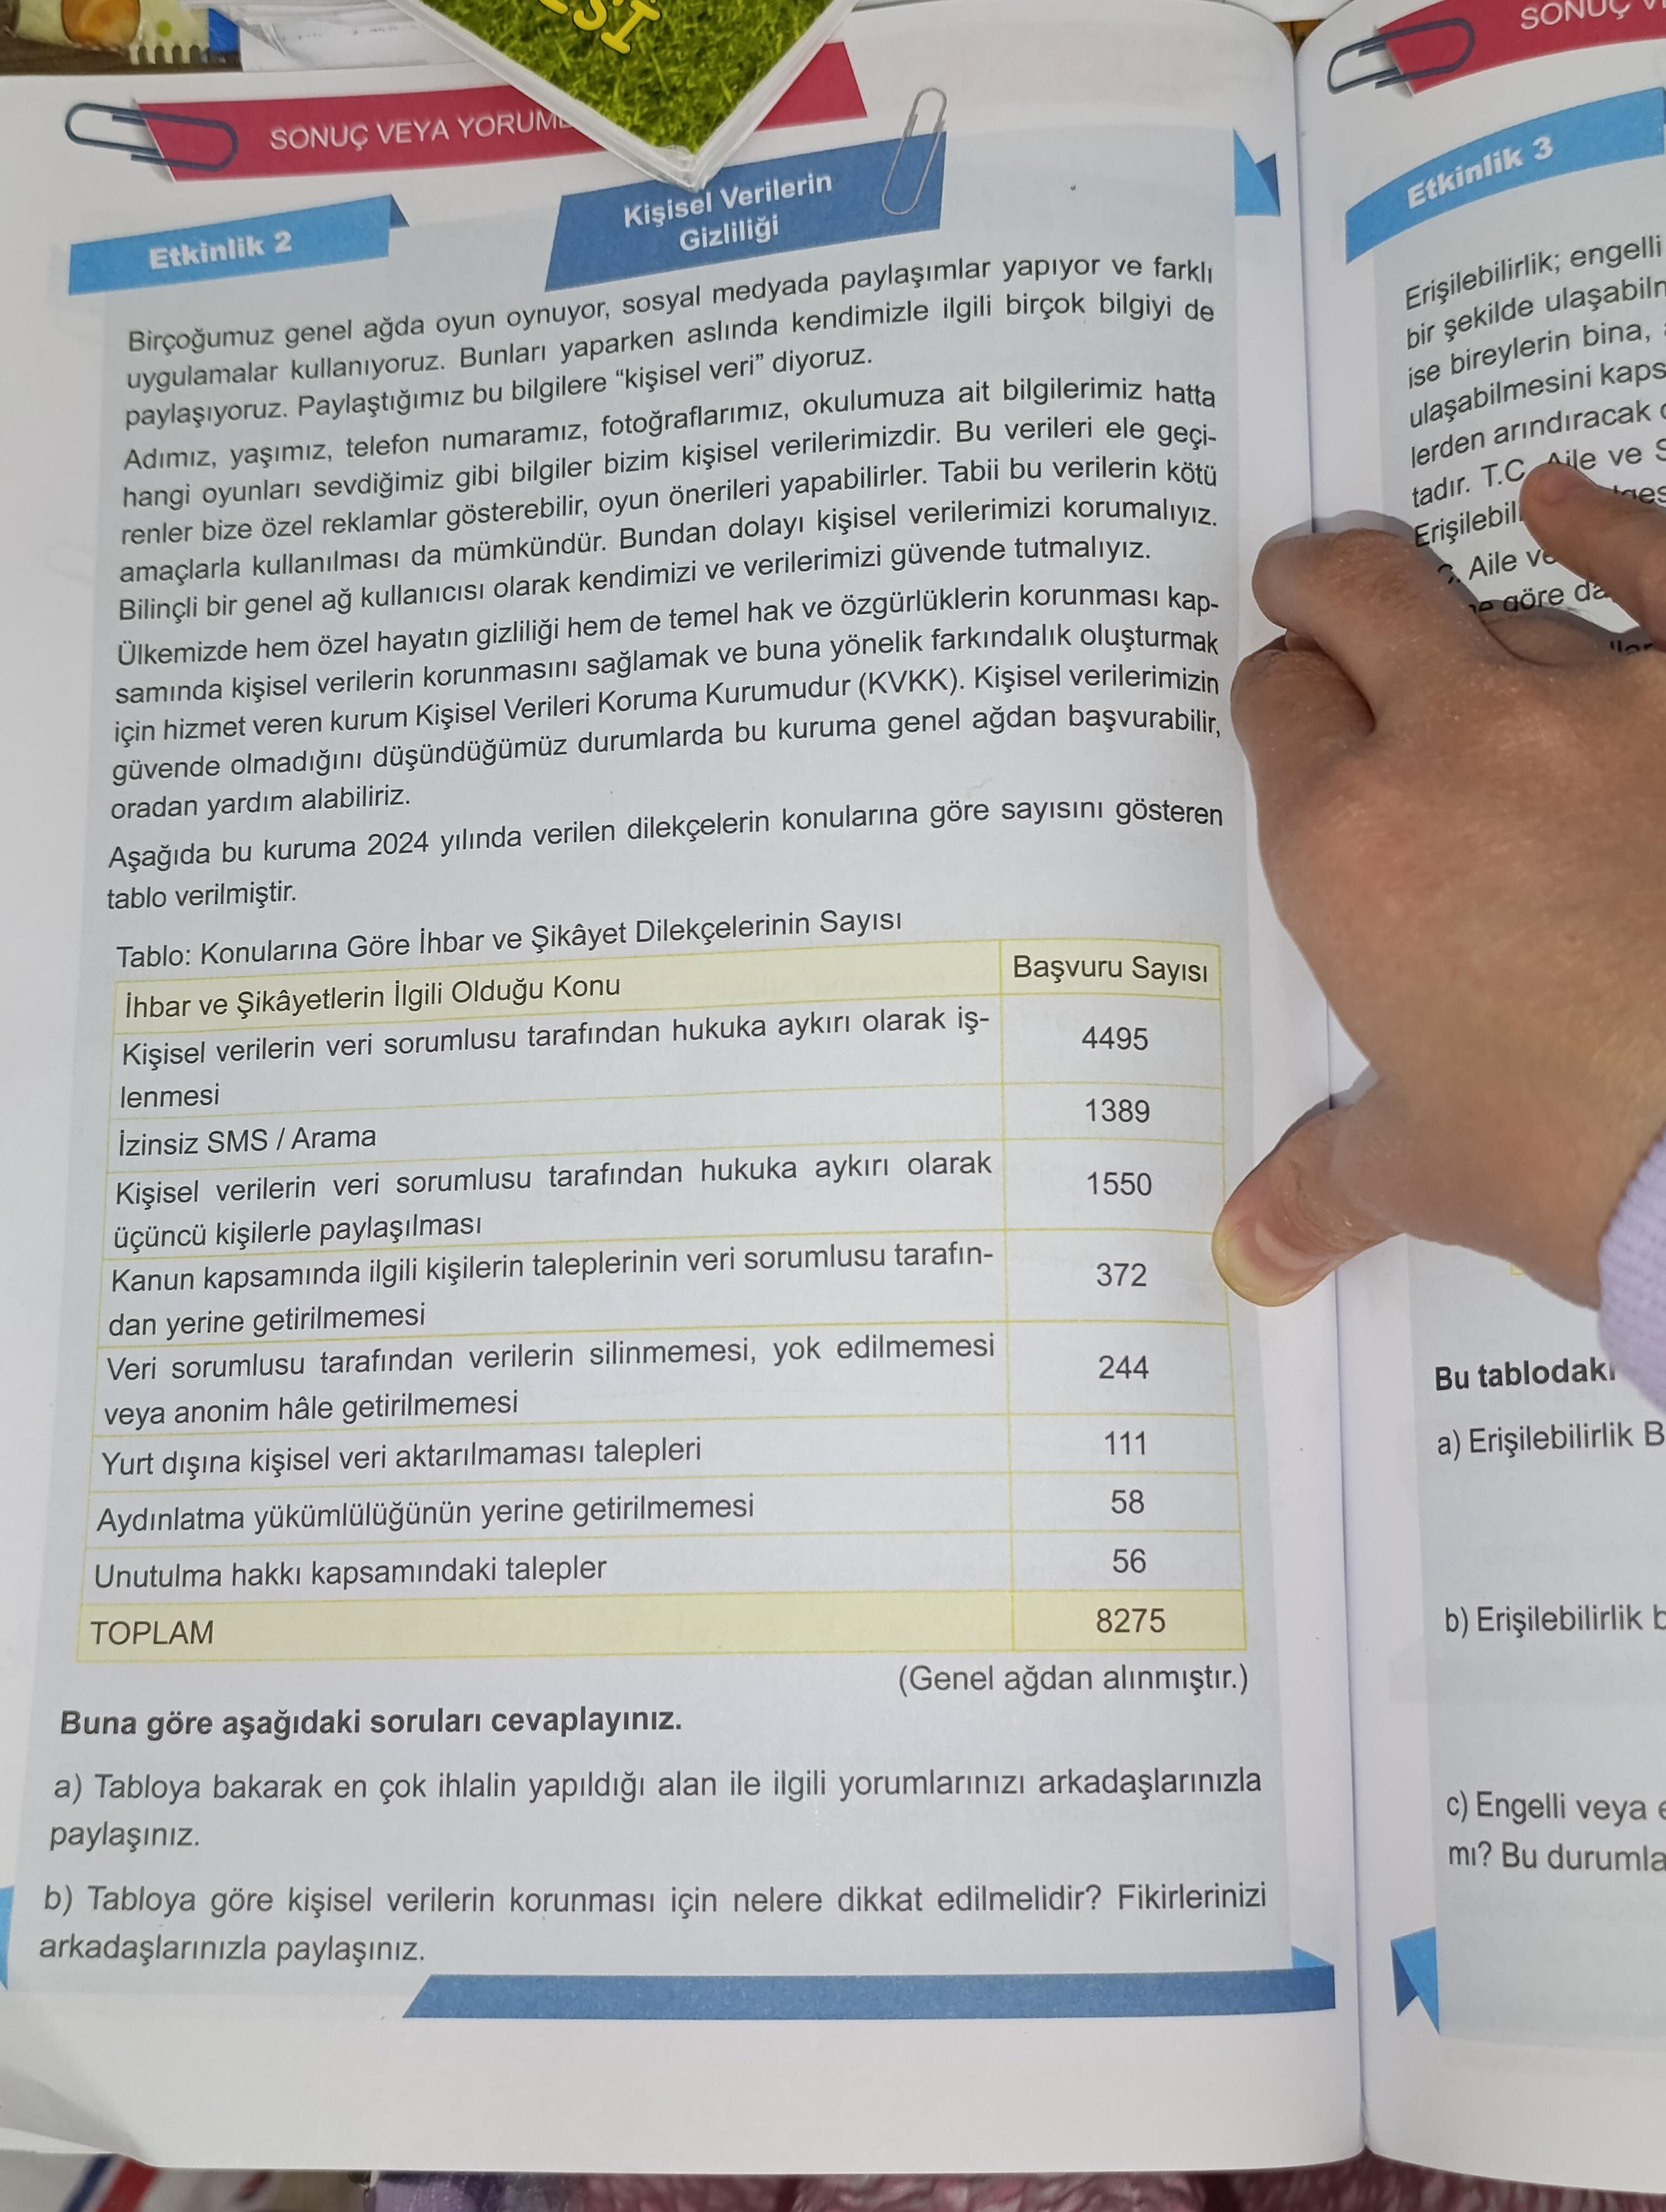
The image you shared from the textbook appears to discuss a case study involving demographic data and questions related to birth statistics, population growth, and predictions based on these numbers. This likely ties to the topic “Sonuç veta yorumları paylaşma” where students engage to share results and commentary on related math problems or exercises about interpreting statistical data.
Understanding the Problem Content
The page shows data about birth rates and population statistics:
- Total population of Turkey in 2000 is given as 6275 (units in thousands or another scale likely).
- Data includes numbers for population groups like females, males, working population, births, deaths, living population, etc.
- There are questions asking to interpret this data, compare birth rates over years, and comment on trends or events such as policies affecting birth rates.
How to Approach These Exercises
-
Identify Key Data Points:
- Look for variables such as total population, birth numbers, mortality rates.
- Understand the relationships: example, birth rate relative to total population or working population.
-
Calculate Growth or Decline:
- Use differences between consecutive years or categories to find increases or decreases.
- Calculate percentages for clarity: e.g., birth rate (%) = (Number of births / Total population) × 100.
-
Answer Theoretical Questions:
- Questions about why birth rates might fluctuate (policy changes, economic reasons).
- Importance of data protection (last question about whether such data should be public).
Step-by-Step Solution Guide for Common Types of Questions:
| Step | Action | Example/Formula |
|---|---|---|
| 1 | Extract data such as total births, population size | From the table, e.g. total births = 75, total population = 6275 |
| 2 | Compute birth rate: births per 1000 people | \text{Birth rate} = \frac{75}{6275} \times 1000 \approx 11.96 |
| 3 | Compare birth rates over years or groups | Check difference and percentage change between years |
| 4 | Analyze demographic shifts and reason for changes | Discuss policies, social-economic trends, natural events |
| 5 | Respond to ethical questions, e.g., data privacy | Explain reasons for confidentiality of personal demographic data |
Common Terms to Know
| Term | Definition |
|---|---|
| Birth Rate | Number of live births per 1000 people in a population per year |
| Mortality Rate | Number of deaths per 1000 people in the population per year |
| Population Growth Rate | Rate at which the population size changes over time, considering births, deaths, immigration |
| Demography | Study of populations, including birth, death, age structure, and migration |
Example Calculation
Suppose the problem asks:
“Calculate the birth rate given total births = 75 and total population = 6275.”
Calculation:
\text{Birth rate} = \frac{75}{6275} \times 1000 = 11.96 \text{ births per 1000 people}
This figure can help contextualize whether the birth rate is high or low by comparison to national averages or other demographic periods.
Summary Table of Relevant Data & Calculations
| Data Type | Value | Units/Notes |
|---|---|---|
| Total Population (2000) | 6275 | Probably in thousands |
| Number of Births | 75 | For the year 2000 |
| Birth Rate (calculated) | 11.96 | Births per 1000 population |
| Number of Deaths | 56 | For the year 2000 |
| Population Increase | 19 | Births minus deaths |
Final Advice for “Sonuç veta yorumları paylaşma”
- Share your computed numerical answers clearly.
- Provide explanations for the observed trends from the data.
- Reflect on the societal or policy impacts if asked.
- Respect privacy and data ethics when discussing demographic data.
Summary:
You can solve the problems by carefully reading the data table, performing percentage and rate calculations for birth and death rates, comparing them over time or groups, and finally commenting on the meaning and implications of the data.
If you want, I can help with specific questions posted in this textbook image or help verify your answers by stepwise calculations.
Aşağıda önce soruda verilen 2006 ve 2004 yılı ölçüm değerlerini tablo olarak düzenledim, ardından
- 2006 yılı ölçümlerine ait daire grafiğini oluşturmak için her bir değerin toplam içindeki payına karşılık gelen açıları hesapladım,
- 2006 yılı verilerinde en büyük ve en küçük ölçüm değeri ile bunların farkını buldum,
- Son olarak grafik ve tablolar üzerinden kısa bir yorum yaptım.
1) Ölçüm Değerleri Tablosu
| Ölçüm Adı | 2006 Ölçüm Değeri | 2004 Ölçüm Değeri |
|---|---|---|
| Ölçülen oksijen doygunluğu ortalaması (%) | 98 | 95 |
| Hastaların vücut kitle indeksi ortalaması | 25 | 23 |
| Haftada bakılan hasta sayısı (kişi) | 1350 | 1100 |
| Yıllık yapılan ameliyat sayısı (işlem) | 243 | 200 |
| Yıllık aşılanan kişi sayısı (kişi) | 2750 | 2250 |
| Yıllık yapılan muayene sayısı (kişi) | 580 | 460 |
| Günlük elektronik randevu talebi sayısı | 400 | 320 |
| Toplam | 5446 | 4448 |
Toplam, tüm ölçüm değerlerinin aritmetik toplamıdır (farklı birimlerdeki değerleri toplamak sayısal karşılaştırma için kullanışlı olmasa da daire grafiği açısını bulmak için gereklidir).
2) Daire Grafiği için Açı Hesaplamaları
Her bir dilimin açısını şöyle bulduk:
\text{Açı} = \frac{\text{İlgili değer}}{\text{Toplam değer}} \times 360^\circ
| Ölçüm Adı | Değer | Açı (yaklaşık) |
|---|---|---|
| Oksijen doygunluğu | 98 | 6{,}47° |
| Vücut kitle indeksi | 25 | 1{,}65° |
| Haftada hasta sayısı | 1350 | 89{,}24° |
| Yıllık ameliyat sayısı | 243 | 16{,}06° |
| Yıllık aşılanan kişi sayısı | 2750 | 181{,}82° |
| Yıllık muayene sayısı | 580 | 38{,}36° |
| Günlük randevu talebi | 400 | 26{,}43° |
| Toplam | 5446 | 360° |
Bu açıları kullanarak bir daire grafiği çiziniz.
- Yatay veya dikey renkli bir lejant hazırlayıp her dilime başlık atın.
- 360°’lik çemberi uygun ölçekte çizin ve açıları merkezden ölçekli olarak yerleştirin.
3) En Büyük – En Küçük Ölçüm ve Aralarındaki Fark
- En büyük ölçüm: Yıllık aşılanan kişi sayısı → 2750
- En küçük ölçüm: Vücut kitle indeksi ortalaması → 25
- Aralarındaki fark: 2750 - 25 = \mathbf{2725}
4) Kısa Yorum
- 2006’da tüm ölçüm değerleri 2004 yılına göre artış göstermiştir.
- Özellikle yıllık aşılanan kişi sayısında ve yıllık muayene sayısında belirgin yükseliş var.
- Bu artışlar, sağlık hizmetlerinin kapasite ve erişilebilirliğinin 2004’ten 2006’ya önemli ölçüde iyileştiğine işaret ediyor.
- Vücut kitle indeksindeki 2 birimlik artış ise toplumun ortalama beslenme ve yaşam tarzındaki değişikliklere dair ipucu verebilir.