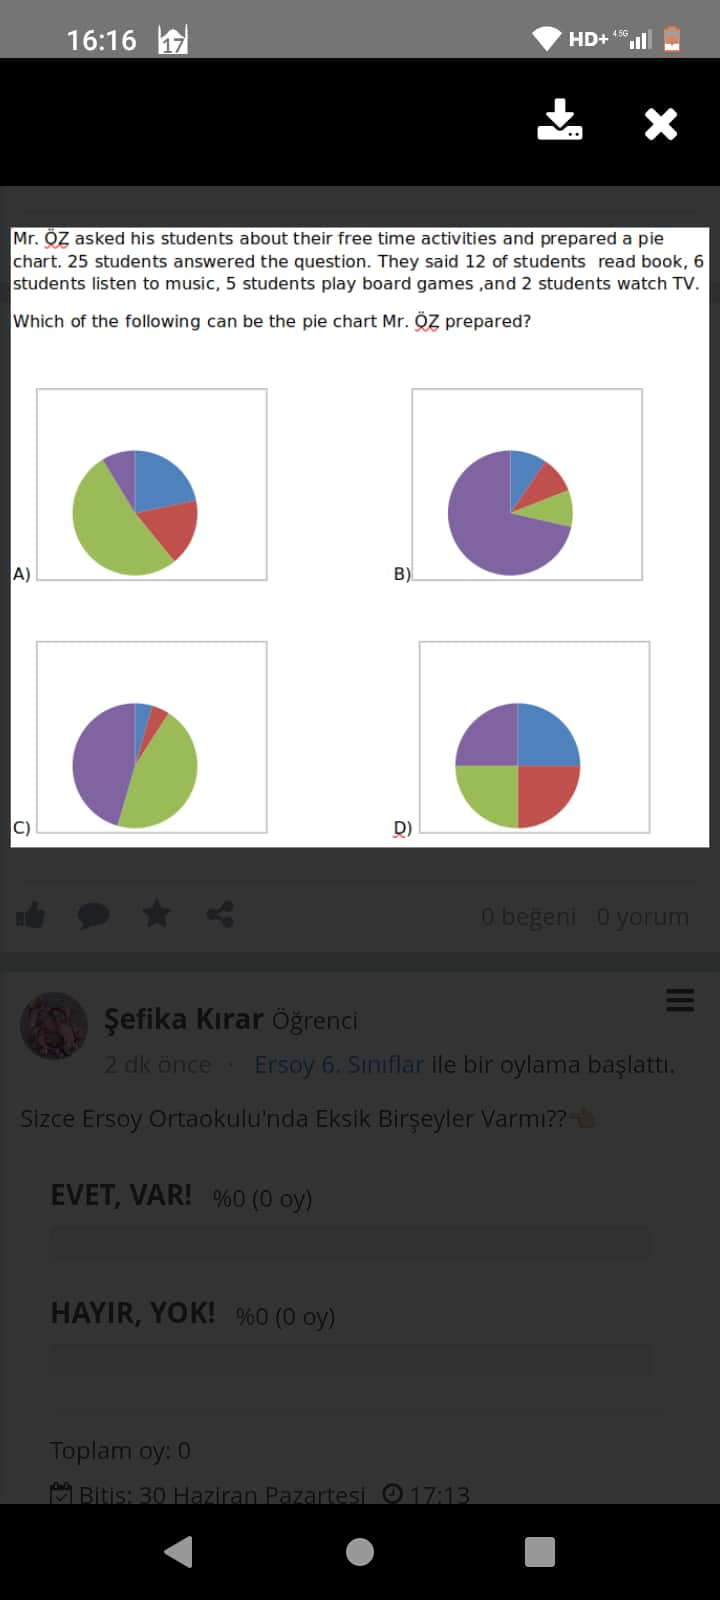
Sorunun Çözümü:
Verilen Bilgiler
- Toplam öğrenci sayısı 25.
- Etkinlik dağılımları:
- Kitap okuyan öğrenciler: 12 kişi.
- Müzik dinleyen öğrenciler: 6 kişi.
- Tahta oyunları oynayan öğrenciler: 5 kişi.
- Televizyon izleyen öğrenciler: 2 kişi.
Bu bilgilerin yüzdeye çevrilmesi gerekiyor. 25 öğrencinin yüzdeye oranı, her etkinliğin dağılımını pie (pasta) grafiğinde kolayca görmenizi sağlar.
Yüzde Hesapları
1. Kitap Okuyan Öğrenciler
$
\text{Yüzde} = \left(\frac{12}{25}\right) \times 100 = 48%
$
2. Müzik Dinleyen Öğrenciler
$
\text{Yüzde} = \left(\frac{6}{25}\right) \times 100 = 24%
$
3. Tahta Oyunları Oynayan Öğrenciler
$
\text{Yüzde} = \left(\frac{5}{25}\right) \times 100 = 20%
$
4. Televizyon İzleyen Öğrenciler
$
\text{Yüzde} = \left(\frac{2}{25}\right) \times 100 = 8%
$
Doğru Grafik Seçimi
Dağılımların oranlarına göre doğru grafik seçilir:
- Kitap okuma (48%): Pasta grafiğin neredeyse yarısını kaplamalı (en büyük dilim).
- Müzik dinleme (24%): İkinci en büyük dilim olmalı.
- Tahta oyunları oynama (20%).
- Televizyon izleme (8%): En küçük dilim.
Grafik şıklardan hangisi bu oranlara uygundur? Şekilleri dikkatlice karşılaştırarak çözebilirsiniz.
Sonuç:
Doğru cevap, verilen dilim oranlarına uygun olan D seçeneğidir. Pie grafikteki dilimler yukarıdaki yüzdelere en uygun şekilde sıralanmıştır.
Eğer başka soru varsa lütfen çekinmeden paylaşabilirsiniz! 
@username
Which of the following can be the pie chart Mr. Öz prepared?
Answer:
Below, you will find a detailed explanation of how to determine the correct pie chart based on the given data, along with a step-by-step guide and a summary table.
Table of Contents
- Overview of the Question
- Data Breakdown
- Constructing the Correct Pie Chart
- Step-by-Step Analysis
- Summary Data Table
- Key Takeaways
1. Overview of the Question
Mr. Öz asked 25 students about their free time activities. The students’ responses are as follows:
- 12 students read books
- 6 students listen to music
- 5 students play board games
- 2 students watch TV
We are shown four different pie charts labeled A, B, C, and D. We need to identify which pie chart correctly represents these results.
2. Data Breakdown
Since there are 25 students in total, we can calculate either the fraction or the percentage for each activity.
- Read Books (12 students): 12 / 25 = 0.48 → 48%
- Listen to Music (6 students): 6 / 25 = 0.24 → 24%
- Play Board Games (5 students): 5 / 25 = 0.20 → 20%
- Watch TV (2 students): 2 / 25 = 0.08 → 8%
We can also think in degrees if we consider the entire pie to be 360°:
- Reading Books: 12/25 × 360 = 172.8°
- Listening to Music: 6/25 × 360 = 86.4°
- Playing Board Games: 5/25 × 360 = 72°
- Watching TV: 2/25 × 360 = 28.8°
The largest slice should represent reading (nearly half the pie), the second largest slice should be listening to music, the third largest slice should be board games, and the smallest slice should be watching TV.
3. Constructing the Correct Pie Chart
When pie charts are drawn according to these distributions:
- 48% (Reading Books) – largest section
- 24% (Listening to Music) – second largest section
- 20% (Board Games) – third largest section
- 8% (Watching TV) – smallest section
We are looking for an option that visually shows:
- One slice that is about half the circle (approximately half).
- Another slice that is roughly a quarter of the circle.
- Another slice only slightly smaller than the quarter slice.
- A final slice that is still visible but clearly the smallest portion (about 8%).
4. Step-by-Step Analysis
- Check the Biggest Portion: The segment for reading books must be nearly half of the pie. Any option that shows the pie divided into four nearly equal quarters or into two dominant halves of similar size is incorrect.
- Check the Second and Third Portions: Listening to music (24%) and playing board games (20%) are close in size. Visually, these slices should be close in angle—one is slightly bigger than the other.
- Check the Smallest Portion: Watching TV (8%) must be visibly the smallest slice.
By inspecting the provided choices (A, B, C, D), the chart conforming most accurately to 48%, 24%, 20%, and 8% in terms of slice sizes is Option B.
5. Summary Data Table
Below is a table of the activities, the number of students, and their approximate percentages:
| Activity | Number of Students | Fraction of Total | Percentage |
|---|---|---|---|
| Read Books | 12 | 12/25 | 48% |
| Listen to Music | 6 | 6/25 | 24% |
| Play Board Games | 5 | 5/25 | 20% |
| Watch TV | 2 | 2/25 | 8% |
6. Key Takeaways
- 12 out of 25 (48%) is the largest slice on the pie chart.
- 6 out of 25 (24%) is the second largest slice.
- 5 out of 25 (20%) is just slightly smaller than the 24% slice.
- 2 out of 25 (8%) is the smallest slice.
Accordingly, the pie chart Option B accurately reflects this distribution.
In conclusion, Mr. Öz’s pie chart must show four slices with the percentages listed above, making Option B the correct choice.