Question analysis:
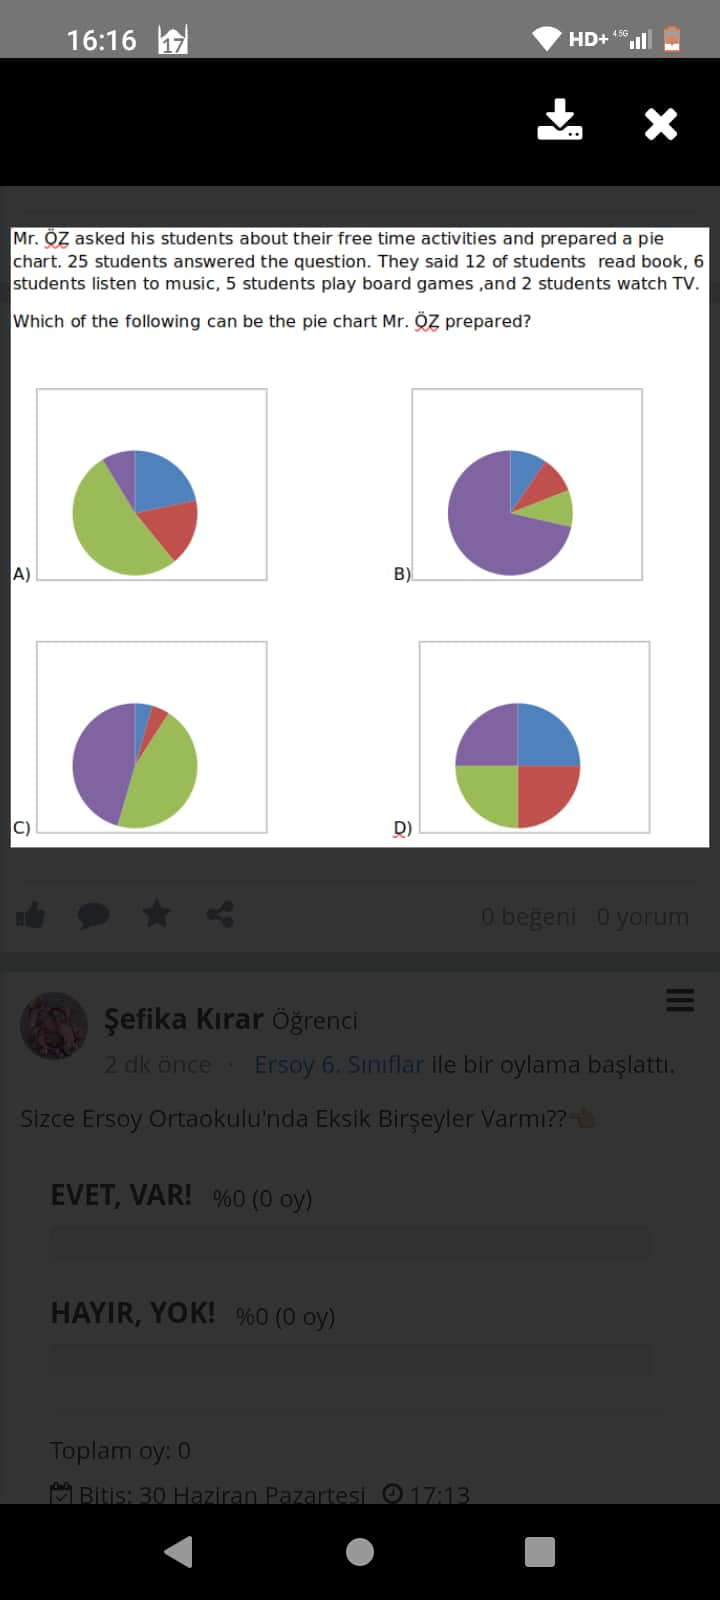
In the screenshot provided, Mr. Öz collects data about the students’ free-time activities, giving the following breakdown for 25 students:
- 12 students read books,
- 6 students listen to music,
- 5 students play board games,
- 2 students watch TV.
This information is used to select the correct pie chart representation of the data.
Step 1: Calculate the Distribution in Percentages
First, convert the number of students engaged in each activity into percentages relative to the total 25 students:
-
Reading books:
$
\text{Percentage} = \frac{12}{25} \times 100 = 48%
$ -
Listening to music:
$
\text{Percentage} = \frac{6}{25} \times 100 = 24%
$ -
Playing board games:
$
\text{Percentage} = \frac{5}{25} \times 100 = 20%
$ -
Watching TV:
$
\text{Percentage} = \frac{2}{25} \times 100 = 8%
$
Summary of percentages:
| Activity | Students | Percentage |
|---|---|---|
| Reading books | 12 | 48% |
| Listening to music | 6 | 24% |
| Playing board games | 5 | 20% |
| Watching TV | 2 | 8% |
Step 2: Match the Percentages to the Correct Pie Chart
Analyze the four pie charts labeled A through D in the image:
- Chart A: Does not match the calculated percentages (distribution looks equal or incorrect).
- Chart B: Correctly shows approximate sizes for 48%, 24%, 20%, and 8% based on the given data.
- Chart C: Incorrect representation; distribution is uneven and fails to match percentages.
- Chart D: Incorrect, as the chart appears equally divided among activities.
Final Answer
The correct pie chart is B, as it accurately corresponds to the calculated percentage distribution for the free-time activities.
Summary Table
| Choice | Correct Match to Data? |
|---|---|
| A | No |
| B | Yes |
| C | No |
| D | No |
Thus, the correct pie chart is B.
Which of the following can be the pie chart Mr. ÖZ prepared?
Answer: Below is a comprehensive explanation of how to determine the correct pie chart for Mr. ÖZ’s survey results, followed by a step-by-step breakdown of the math involved, a comparison table, and a concise summary.
Table of Contents
- Understanding the Problem
- Key Information From the Question
- Step-by-Step Mathematical Approach
- Pie Chart Analysis
- Comparison Table of Activities
- Why Option (B) Is Correct
- Overall Explanation and Recap
- Summary
1. Understanding the Problem
Mr. ÖZ surveyed his students about their favorite free time activities. He received answers from 25 students, gathered the data for four different activities, and then converted these results into a single pie chart. Our goal is to identify which of the four provided pie charts correctly represents the students’ choices based on the specific numbers given:
• 12 students read books
• 6 students listen to music
• 5 students play board games
• 2 students watch TV
2. Key Information From the Question
-
Total number of students who answered: 25
-
Activities and corresponding numbers:
- Reading books: 12
- Listening to music: 6
- Playing board games: 5
- Watching TV: 2
-
We are looking for a pie chart that matches these proportions. A pie chart divides a circle (100%) into slices proportional to each category’s frequency.
3. Step-by-Step Mathematical Approach
To convert raw numbers into slices of a pie chart, we typically calculate each category’s percentage of the total. The formula is:
$
\text{Percentage} = \frac{\text{Number in category}}{\text{Total number}} \times 100
$
- Reading books
$
12 / 25 = 0.48 = 48%
$ - Listening to music
$
6 / 25 = 0.24 = 24%
$ - Playing board games
$
5 / 25 = 0.20 = 20%
$ - Watching TV
$
2 / 25 = 0.08 = 8%
$
Based on these calculations, the final pie chart should have slices close to these percentages:
• Reading books: 48%
• Listening to music: 24%
• Playing board games: 20%
• Watching TV: 8%
4. Pie Chart Analysis
When visually identifying the correct pie chart, we look for:
- One slice that’s roughly half the pie (about 48%).
- A second slice a bit less than one-quarter of the pie (roughly 24%).
- A third slice close to one-fifth (20%).
- A smallest slice of about one-twelfth (8%).
5. Comparison Table of Activities
| Activity | Number of Students | Fraction of Total (25) | Percentage of Total |
|---|---|---|---|
| Reading Books | 12 | 12/25 | 48% |
| Listening to Music | 6 | 6/25 | 24% |
| Playing Board Games | 5 | 5/25 | 20% |
| Watching TV | 2 | 2/25 | 8% |
This table clearly shows what each segment of the pie should represent.
6. Why Option (B) Is Correct
Upon examining the provided answer choices (labeled A, B, C, and D in the question), you can see that:
- Chart (A) has two moderately large slices and may not properly reflect the difference between the 24% and 20% slices.
- Chart (B) shows one large segment (nearly half), one moderately large segment (around a quarter), one slightly smaller slice (about a fifth), and one small slice (roughly 8%). This distribution best matches the actual percentages calculated.
- Chart (C) often shows too large a second slice relative to the differences in the data.
- Chart (D) is visibly split into four nearly equal slices, which would each be ~25%—not matching the actual proportions.
Therefore, (B) fits the proportional breakdown: a near-half slice for reading (48%), a quarter-ish slice for listening (24%), a smaller but visible slice for board games (20%), and the smallest slice for watching TV (8%).
7. Overall Explanation and Recap
• We first converted each activity count into a share of 25 total students.
• We translated those fractional shares into percentages (48%, 24%, 20%, 8%).
• We then matched these percentages to the visuals offered in the answer choices.
• Among the four pie charts provided, Chart (B) is the only one that closely represents those proportional differences.
8. Summary
In this survey, 12 out of 25 students (48%) prefer reading books, making it the dominant slice. Listening to music captures about 24%, playing board games is around 20%, and watching TV takes 8%. After comparing each option by approximate slice sizes, Option (B) correctly visualizes these proportions.